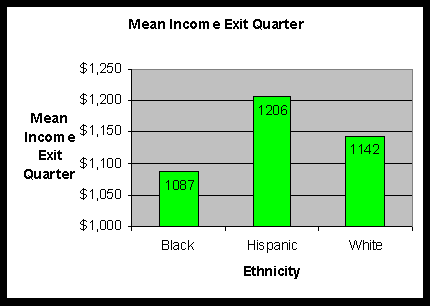
 Chart 1: Mean Income Exit Quarter
Racial Disparities in Florida Welfare Reform
A Study of Income Levels for Black, Hispanic, and White Post-Welfare Recipients
Robert E. Beneckson M.S.
Senior Researcher
e-mail: rb4@bigfoot.com@bigfoot.com
Marvin Dunn Ph.D.
Mentor
Anjenys Gonzalez B.S.
Community Organizer
Clara Marichal M.L.A.
Research Assistant
Racial Disparities in Florida Welfare Reform
Introduction
One area of concern that has arisen with the passage of the Personal Responsibility and Work Opportunities Reconciliation Act (PRWORA) of 1996 is the potential for racial disparities in the implementation of the law. Around the country some researchers have begun to look into this question, but the focussed work on racial disparities is still in the early stages.
Susan Gooden, Ph.D. of the Center for Public Administration and Policy (CPAP) of Virginia Tech studied 223 female welfare recipients in the Culpeper region of Virginia on various dimensions of employment status and found among other things that, "In general, blacks earn less than whites, are less likely to be employed full time and are over-represented in lower paying occupations."
Clark, Jarmon, and Langley studied 140 welfare leavers in five rural Florida counties and found, "Significant racial differences in employment and income were noted in our data. First, whites were more likely than Blacks to be currently employed (49.3% vs. 32.7%). Second, Black workers earned significantly less per hour than did White workers, and Blacks had household incomes that were two-thirds of White respondents."
Both these studies looked at relatively small samples in a few counties and have made important contributions to the research on racial disparities in welfare reform. One example of a larger scale study is the Urban Institute’s study of general racial and ethnic disparities (not confined to welfare recipients) that used the data from the 1997 National Survey of America’s Families (NSAF) and studied poverty, family structure, child support, food and housing hardship, health status and insurance coverage, and found that "black, Hispanic and Native American families face hardship that is not tied to income alone….over one-half of low income blacks, Hispanics, and Native Americans experienced hardship. Even at higher incomes, blacks, Hispanics and Native Americans are nearly twice as likely to experience food hardships as whites."
With these studies in mind, and with our interest in studying the results of the devolution of welfare delivery to the states rather than the federal government, we set out to study income levels of former welfare recipients in Florida.
Methodology
We attempted to discover what objective data obtained from the Florida Education and Training Placement Information Program (which tracks income information for all recipients who leave welfare for all 67 counties in Florida) would reveal about potential differences in income level between racial groups who left welfare during the same time period. The data sample began in the first quarter of 1998 and followed the mean income levels for a 12-month period for those who left welfare in the first quarter of 1998. This means that we were able to study the reported income level, separated by racial group (black, Hispanic, and white), of people who left welfare in 1998 and track their income by group through the fourth quarter of 1998.
We used a one-way ANOVA, F (2,27) = 4.84, p = .016, to determine if the differences between mean income levels for each racial group differed at the .05 level of significance. The data was reported for 24 "County Regions" (one or more counties combined) by quarter and by race, and followed for 12 months. An example for Broward County follows:
Table 1: Broward County
|
1 |
2 |
3 |
4 |
5 |
6 |
7 |
8 |
9 |
10 |
11 |
12 |
13 |
|
County |
ethnicity |
yrqtr |
nexqtr |
extqtr |
np3mo |
p3mo |
np6mo |
p6mo |
np9mo |
p9mo |
np12mo |
p12mo |
|
Broward |
Black |
981 |
647 |
$1230 |
604 |
$3724 |
609 |
$2018 |
575 |
$2278 |
635 |
$2155 |
|
Hispanic |
981 |
112 |
$1197 |
108 |
$4462 |
108 |
$2521 |
112 |
$2636 |
105 |
$2883 |
|
|
White |
981 |
168 |
$1422 |
151 |
$4106 |
156 |
$2585 |
151 |
$3066 |
181 |
$2818 |
In this table column 4 shows the number of welfare recipients in each ethnic group in Broward County who left welfare in the first quarter of 1998 and then reported income during the exit quarter. Column 5 reports the income for the exit quarter for each ethnic group. Column 6 reports the number of former recipients who reported income for the 3-month period following the exit quarter; column 7 reports the income level for that period and so on until column 12 and 13 report the same information for 12 months after leaving welfare.
Data in this format from all 24 County Regions of Florida were analyzed for the first quarter of 1998 through the fourth quarter of 1998 and was used to compare the mean income of blacks, Hispanics, and whites statewide.
Table 2: Statewide Totals
|
1 |
2 |
3 |
4 |
5 |
6 |
7 |
8 |
9 |
10 |
11 |
12 |
13 |
|
county |
ethnicity |
yrqtr |
nexqtr |
extqtr |
np3mo |
p3mo |
np6mo |
p6mo |
np9mo |
p9mo |
np12mo |
p12mo |
|
Florida |
Black |
981 |
7676 |
$26096 |
7462 |
$78135 |
7146 |
$43173 |
6952 |
$48752 |
7312 |
$44482 |
|
Totals |
Hispanic |
981 |
2505 |
$22920 |
2448 |
$83060 |
2378 |
$46473 |
2295 |
$51483 |
2426 |
$53633 |
|
1998 |
White |
981 |
5226 |
$25978 |
4961 |
$81832 |
4669 |
$47777 |
4460 |
$53067 |
4648 |
$52412 |
This table shows the statewide totals beginning in the first quarter of 1998. Column 4 shows the total number of recipients in each ethnic group who left welfare and reported income beginning in the first quarter of 1998, which was their exit quarter. Column 5 is the total of the mean income for each group for all 24 County Regions for the exit quarter. Column 6 is the total number of former recipients for the 3-month follow-up and column 7 is the total mean income for each group. In the same pattern of reporting, columns 8, 10, and 12 report the total number of former recipients for each group for the 6-month, 9-month, and 12-months follow-up periods and columns 9, 11, and 13 report the total mean income for each group for those time periods, respectively.
Results
The data for the exit quarter (quarter one of 1998) shows that there was no statistically significant difference between the mean income of black and white former welfare recipients. However, the Hispanic group had significantly higher income than both the black and white groups in the exit quarter. Black income in the exit quarter was 90.1% of Hispanic income and 95% of white income, while white income was 94.6% of Hispanic income. Hispanic income was the highest in every quarter and is used as the reference income for the other groups.
 Chart 1: Mean Income Exit Quarter
Table 3: Statistical Analysis Exit Quarter
Multiple Comparisons1
Dependent Variable: Income exit quarter
Tukey HSD
|
(I) Ethnicity (J) Ethnicity |
Mean Difference (I-J) |
Std. Error |
Sig. |
95% Confidence Interval |
|
|
Lower Bound |
Upper Bound |
||||
|
Black Hispanic White |
-256.6180* 26.7622 |
53.2035 41.7236 |
.000 .798 |
-384.2295 -73.3142 |
-129.0064 126.8385 |
|
Hispanic Black White |
256.6180* 283.3801* |
53.2035 55.9872 |
.000 .000 |
129.0064 149.0918 |
384.2295 417.6685 |
|
White Black Hispanic |
-26.7622 -283.3801* |
41.7236 55.9872 |
.798 .000 |
-126.8385 -417.6685 |
73.3142 -149.0918 |
Based on observed means.
* The mean difference is significant at the .05 level.
The data for the post 3-month report shows that Hispanics continue to have the highest mean income level, with the white group next, earning 90% of the Hispanic group, and the black group last in mean income with 81% of the Hispanic group’s income and 90.9% of the white group’s mean income. Notice that although the black group’s income has fallen from 95.1% of the white group’s to 90.1% since the exit quarter, the disparity in income has not yet reached a statistically significant difference. However, the Hispanic group remains statistically different than both the white and black groups.
Chart 2: Mean Income Post 3 Months
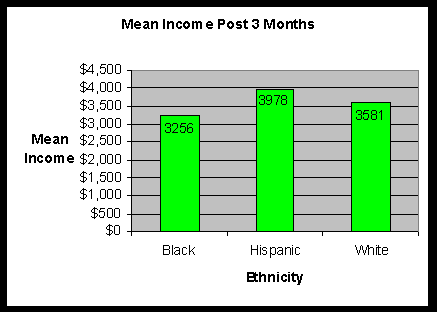
Table 4: Statistical Analysis Post 3 Months
Multiple Comparisons
1Dependent Variable: Income post 3 months
Tukey HSD
|
(I) Ethnicity (J) Ethnicity |
Mean Difference (I-J) |
Std. Error |
Sig. |
95% Confidence Interval |
|
|
Lower Bound |
Upper Bound |
||||
|
Black Hispanic White |
-923.7148* -196.4968 |
118.4126 93.7784 |
.000 .098 |
-1207.537 -421.2734 |
-639.8927 28.2797 |
|
Hispanic Black White |
923.7148* 727.2180* |
118.4126 125.1606 |
.000 .000 |
639.8927 427.2218 |
1207.5370 1027.2142 |
|
White Black Hispanic |
196.4968 -727.2180* |
93.7784 125.1606 |
.098 .000 |
-28.2797 -1027.214 |
421.2734 -427.2218 |
Based on observed means.
* The mean difference is significant at the .05 level.
At the post 6-month level some changes become manifest. At this point the mean income for both the black and white group continues to differ significantly from the Hispanic group, but the black and white group’s mean income now also differ significantly from each other, with the white group being the greater. Black mean income for welfare leavers at 6-months post-leaving welfare is now 80.7% of the Hispanic group and 85% of the white group. Mean income for white welfare leavers at the 6-month level is 94% of the Hispanic group.
Chart 3: Mean Income Levels Post 6 Months
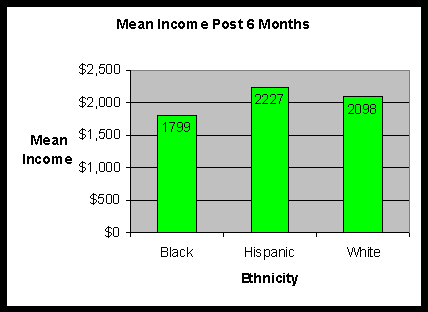
Table 5: Statistical Analysis Post 6 Months
Multiple Comparisons1
Dependent Variable: Income post 6 months
Tukey HSD
|
(I) Ethnicity (J) Ethnicity |
Mean Difference (I-J) |
Std. Error |
Sig. |
95% Confidence Interval |
|
|
Lower Bound |
Upper Bound |
||||
|
Black Hispanic White |
-504.7991* -222.1503* |
57.2953 45.8282 |
.000 .000 |
-642.1297 -331.9956 |
-367.4685 -112.3050 |
|
Hispanic Black White |
504.7991* 282.6488* |
57.2953 60.7450 |
.000 .000 |
367.4685 137.0497 |
642.1297 428.2479 |
|
White Black Hispanic |
222.1503* -282.6488* |
45.8282 60.7450 |
.000 .000 |
112.3050 -428.2479 |
331.9956 -137.0497 |
Based on observed means.
* The mean difference is significant at the .05 level.
1
Weighted Least Squares Regression – Weighted by Number of people post 6 months
At the 9-month post exit level the mean income for the Hispanic group remains significantly higher than the mean income for the black and white groups, and the white group’s mean income remains significantly higher than the mean income for the black group. At this point, the mean income for the black group is 82.5% of the Hispanic group and 86.8% of the white group while the white group has a mean income which is 95% of the Hispanic group.
Chart 4: Mean Income Post 9 Months
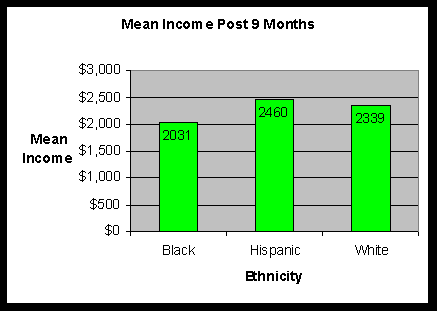
Table 6: Statistical Analysis Post 9 Months
Multiple Comparisons1
Dependent Variable: Income post 9 months
Tukey HSD
|
(I) Ethnicity (J) Ethnicity |
Mean Difference (I-J) |
Std. Error |
Sig. |
95% Confidence Interval |
|
|
Lower Bound |
Upper Bound |
||||
|
Black Hispanic White |
-611.6900* -220.1208* |
67.5910 54.2645 |
.000 .000 |
-773.6984 -350.1869 |
-449.6817 -90.0546 |
|
Hispanic Black White |
-611.6900* 391.5693* |
67.5910 71.8659 |
.000 .000 |
449.6817 219.3145 |
773.6984 563.8240 |
|
White Black Hispanic |
220.1208* -391.5693* |
54.2645 71.8659 |
.000 .000 |
90.0546 -563.8240 |
350.1869 -219.3145 |
Based on observed means.
* The mean difference is significant at the .05 level.
1
Weighted Least Squares Regression – Weighted by Number of people post 9 months
At the 12-month post leaving welfare level the statistical difference between the mean incomes for all 3 groups that began with the 6-month report has continued, and the differences in mean income level for the black group compared to the Hispanic and white group has expanded. Blacks as a group are now making only 75.4% of the mean Hispanic income and 80.5% of the mean white income. Whites as a group are making 93.6% of Hispanic income, a figure which has remained relatively consistent since the exit quarter even though black income as a percentage of the mean income for both the Hispanic and white groups has fallen.
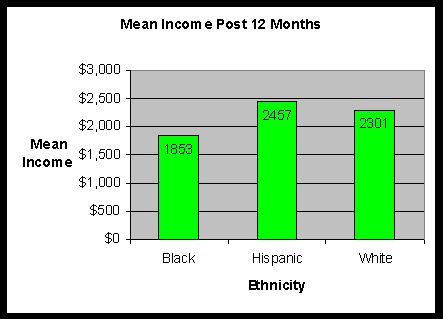 Chart 5: Mean Income Post 12 Months
Table 7: Statistical Analysis Post 12 Months
Multiple Comparisons1
Dependent Variable: Income post 12 months
Tukey HSD
|
(I) Ethnicity (J) Ethnicity |
Mean Difference (I-J) |
Std. Error |
Sig. |
95% Confidence Interval |
|
|
Lower Bound |
Upper Bound |
||||
|
Black Hispanic White |
-704.1390* -308.9003* |
88.7210 71.3358 |
.000 .000 |
-916.7227 -479.8275 |
-491.5552 -137.9732 |
|
Hispanic Black White |
704.1390* 395.2386* |
88.7210 94.4042 |
.000 .000 |
491.5552 169.0375 |
916.7227 621.4398 |
|
White Black Hispanic |
308.9003* -395.2386* |
71.3358 94.4042 |
.000 .000 |
137.9732 -621.4398 |
479.8275 -169.0375 |
Based on observed means.
* The mean difference is significant at the .05 level.
1
Weighted Least Squares Regression – Weighted by Number of people post 12 months
In an effort to ascertain if this data was consistent over time we analyzed data from the fourth quarter of 1998 with the same measures as for the first quarter. We found that the same trends held. Presented here as an example are the data for the 12-month follow up period for those who left welfare in the fourth quarter of 1998. This data takes us right up to the cusp of the year 2000, as it represents information collected through December 1999.
Chart 6: Mean Income Post 12 Months (For Quarter 4, 1998)
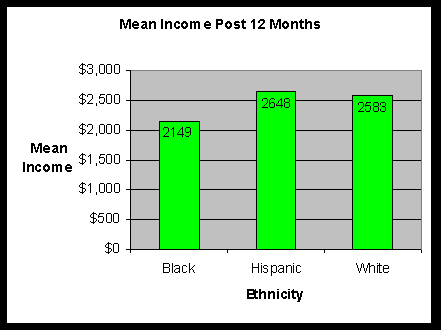
Table 8: Statistical Analysis Post 12 Months (For Quarter 4, 1998)
Multiple Comparisons1
Dependent Variable: Income post 12 months
Tukey HSD
|
(I) Ethnicity (J) Ethnicity |
Mean Difference (I-J) |
Std. Error |
Sig. |
95% Confidence Interval |
|
|
Lower Bound |
Upper Bound |
||||
|
Black Hispanic White |
-724.2108* -295.3508* |
130.985 89.599 |
.000 .005 |
-1038.6190 -510.4185 |
-409.8026 -80.2832 |
|
Hispanic Black White |
724.2108* 428.8599* |
130.985 143.574 |
.000 .011 |
409.8026 84.2348 |
1038.6190 773.4851 |
|
White Black Hispanic |
295.3508* -428.8599* |
89.599 143.574 |
.005 .011 |
80.2832 -773.4851 |
510.4185 -84.2348 |
Based on observed means.
* The mean difference is significant at the .05 level.
1
Weighted Least Squares Regression – Weighted by Number of people post 12 months
The data for the 12-month follow-up of the fourth quarter of 1998 demonstrates the same trends as the data for the first quarter that we have reported in detail. All three ethnic groups differ significantly from each other with blacks being the lowest in mean income, whites the next highest, and Hispanics having the highest mean income. The mean income for blacks is 81.1% of Hispanics and 83.1% of whites. White mean income is 97.5 % of Hispanics. This is very similar to the data reported for those who left welfare during the first quarter of 1998 and lends some support to the belief that these differences in mean income are not mere anomalies, but have some stability over time.
Conclusions
As the data from this study of the mean income levels of Floridians who left welfare in the first quarter of 1998 demonstrates, there are significant racial disparities between the income levels of blacks, Hispanics, and whites, with the black group lagging behind the other two groups. With this established, the question becomes "How does one account for these disparities?" Factors like educational level, differential training, differences in motivation and readiness for work, job assistance offered by the welfare system, and the possibility of racial discrimination are all potential areas for future study. Further research into these factors will be required to provide solid information to account for the differences in income which this study has documented. What cannot be denied in the face of these data is that for those who left welfare in the first quarter and fourth quarters of 1998, racial disparities in income levels between blacks, Hispanics, and whites exist, with black income being significantly less than that of both Hispanics and whites. Over the time period we analyzed, the gap in income between the black group and the Hispanic and white groups increased, while the relationship of income level between the other two groups remained relatively constant. That these trends have consistency is supported by data from the fourth quarter of 1998, which shows similar patterns.
References
Clark, Leslie L., Brenda Jarmon, and Merlin R. Langley, "People Who Have Left WAGES."
A Qualitative Study of WAGES. FL: Inter-University Welfare Reform Collaborative, Fall 1999.
http://ssw.fsu.edu/welfare/index.html
Gooden, Susan T. "Race and Welfare Report: Examining Racial Differences in Employment Status among Welfare Recipients," January 1, 1997.
http://www.arc.org/gripp/eventsUpdates/goodenReport/reportTitlePg.html
Staveteig, Sarah and Alyssa Wigton. Racial and Ethnic Disparities: Key Findings From the National Survey of America’s Families. Washington D.C.: The Urban Institute, February 2000.
http://newfederalism.urban.org/pdf/anf_b5.pdf
Acknowlegements
Special appreciation is due to Anthony Carter of the Florida Education and Training Placement Information Program, who very graciously provided the extensive statewide data we used in this study and to Guillermo Wated of the Statistical Consulting Department of Florida International University, whose help was invaluable in the statistical analysis.